+61-1300-332-888
 +1-480-241-8198
Our Blogs
In this blog we will be discussing bivariate analysis through Visualization in which we will be taking care of two or more variable at the same time. Through this we can see the correlation, interaction and relationship between two variables. For this we will be using python internal dataset “tips”
Importing the libraries
import pandas as pd
import numpy as np
import seaborn as sns
importmatplotlib.pyplot as plt
%matplotlib inline
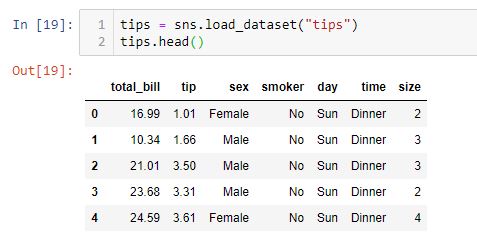
Importing the dataset
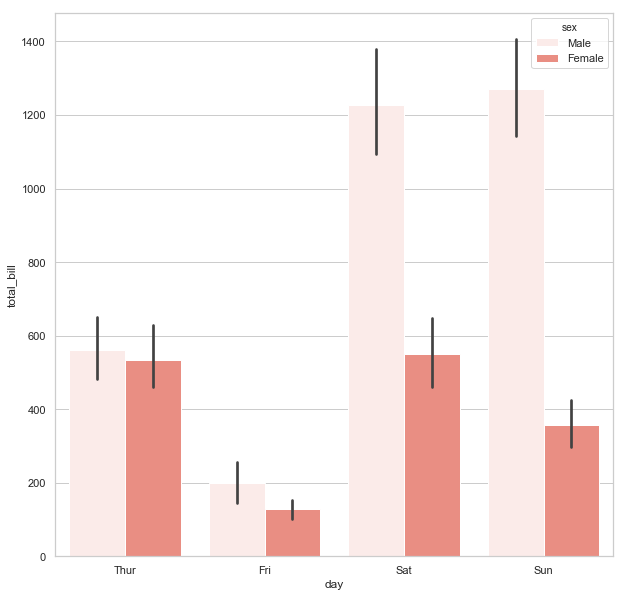
Bar Plot
Bar plots uses bars to compare data between different categories. It can be horizontally or vertically aligned.
sns.set(rc={‘figure.figsize’:(10,10)})
sns.set(style=”whitegrid”)
ax = sns.barplot(x=”day”, y=”total_bill”,hue=”sex”, data=tips,estimator = sum,color=”salmon”)
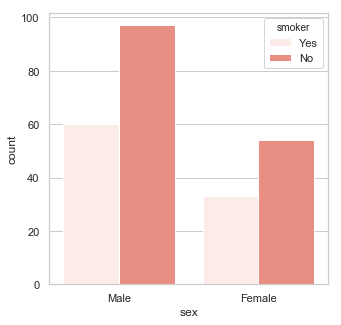
Count Plot
It is used to plot the frequency of each unique observation in a categorical variable.
# ‘hue’ is used to as an additional variable in the existing graph
sns.countplot(tips.sex, hue=tips.smoker,color=”salmon”)
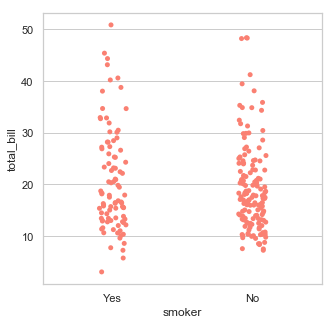
Strip Plot
Strip Plot is used to see the distribution of a continuous variable with respect to different levels of a categorical variable.
sns.stripplot(tips[‘smoker’],tips[‘total_bill’] , jitter=True,color=”salmon”)
Pair Plot
A pair plot is used to see the pairwise relationship between the variables in a dataset.
sns.pairplot(tips,hue=’smoker’)

Conclusion: – In this blog we have discussed different visualization that can be used for two or more variables; through these you can determine correlation and association between variables.
About Girikon
As a leading provider of Salesforce consulting and implementation services, Girikon is spearheaded by a team of proficient Salesforce developers, consultants, testers and more.
About Author

Saurav is a software developer with more than 8 years of experience in Talend, Excel, Tableau, SQL, Python and R. He is also a data science enthusiast and works on different data science algorithms like Regression, linear model, Random forest and Neural network to name a few.
Share this post on: